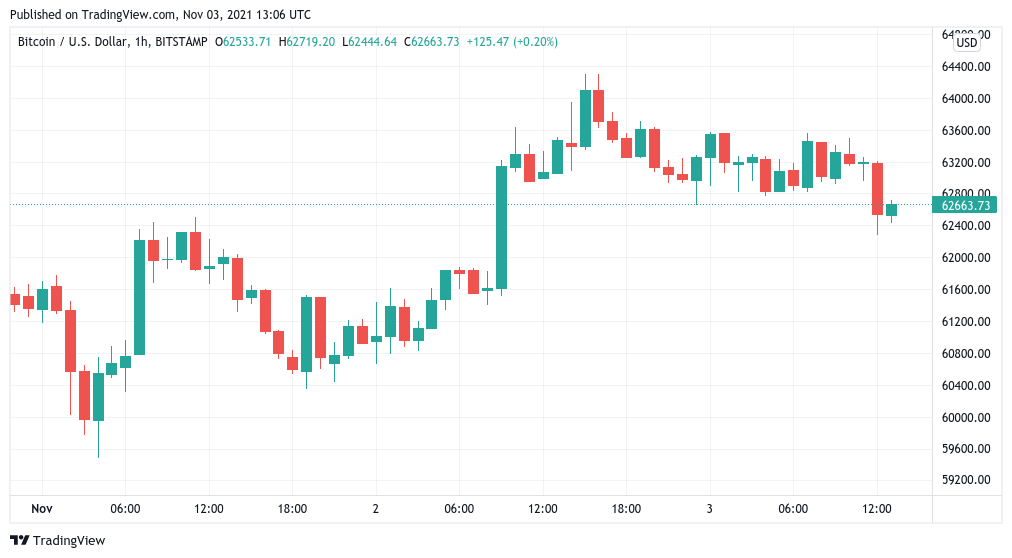
Bitcoin (BTC) fell to 24-hour lows before Wall Street’s open on Nov. 3 as a previous bull run halted at $64,000.
BTC price inches back toward $62,000
Data from Cointelegraph Markets Pro and TradingView confirmed the return of uninspiring sideways price action after Tuesday’s volatility.
As Cointelegraph reported, BTC/USD rose almost $4,000 before topping out, with momentum then fading away to produce lows of $62,400 at the time of writing.
As ever for a post-halving Q4, analysts continued to cast aside any bearish theories.
“Market looks primed,” popular Twitter account TechDev summarized.
A separate post reexamined Fibonacci levels that have determined Bitcoin price cycle tops in both the 2013 and 2017 post-halving Q4 periods.
Should BTC/USD repeat history, even the upcoming 4.236 extension at $73,500 would mark the start, not the end, of the most intense phase of gains.
“Will it mark the top, or will we top just above log 2.272 once again? I cannot say for certain of course, but I do expect the top of the 2-week RSI channel to tell us,” he wrote, referencing Bitcoin’s bullish relative strength index.
“But if you expect neither, and instead think BTC will suddenly top at the linear 4.236 for the first time in history, with the 2-week RSI also failing to hit the channel for the first time in history… To me that is an extremely low probability bet.”

For the short term, funding rates once again creeping higher coincided with the price drawdown.
SOL replaces DOT in altcoin all-time high fest
Altcoins continued to be anything but placid Wednesday as Ether (ETH) continued to new all-time highs.
Related: Bitcoin ‘Moonvember’ begins as data shows November is best month for S&P 500
ETH/USD was joined by Solana (SOL), which launched its own comeback to see all-time highs of $235 on the day.

Polkadot (DOT), which also broke new records on Tuesday, meanwhile, took a breather, still trading above $50 at the time of writing.
Cointelegraph earlier reported on predictions that place ETH at up to $14,000 and DOT at $100 next.


