The last time Bitcoin saw six-monthly green candles in a row was in 2013
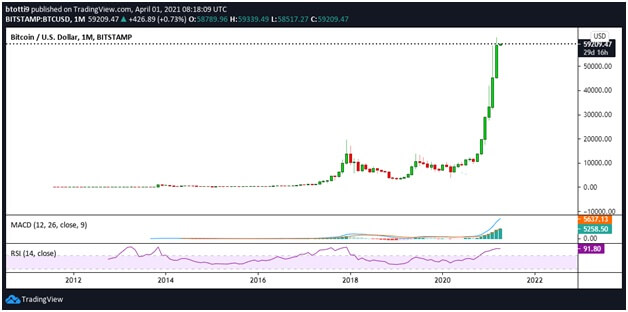
Bitcoin (BTC) price closed March in the green to record the sixth consecutive green candle on the monthly log. It is the first time the top cryptocurrency has achieved this since a similar run in 2012—2013.
The bullish streak has seen Bitcoin’s price break above $61,000, and confirmation of another monthly green candle could see it set another record over what is expected to be a bullish April.
At the moment, BTC/USD is trading near $59,000, with bulls focused on retaking control towards $60k after several near misses over the past few days.
BTC price monthly outlook
The last time BTC price recorded six bullish monthly candles in a row was in April 2013. At the time, BTC/USD had surged to a then all-time high of $260, having traded at lows of $10 in November 2012.
The upside was, however, followed by a 40% decline over two months, with BTC declining to around $90. A steady climb was followed by an explosive October and November that saw prices soar over 500% to cross $1000 for the first time.
Bitcoin price saw a similar trend in the months leading up to the 2017 bull market, though this time the top crypto had seen five bullish monthly candles in a row. Another decline followed the five-month bull run, before the next three candles included the rally that took BTC/USD to highs of $20,000.
Another bullish flip in 2019 saw five consecutive monthly green candles take Bitcoin from lows of $3,300 to highs of $14,000. But like in the previous instances, this too was followed by a steady price crash that hit a bottom in March 2020 when BTC sank to lows of $3,800.
The current bull market might be different given the institutional interest and massive merchant adoption led by the likes of PayPal. Thus, BTC/USD could break higher and reach forecast levels of $80,000 or more before retracing.
However, Bitcoin looks a little overstretched following the 2021 explosive run. The monthly RSI is in overbought territory and is extending above 90, which, in the past, preceded a significant correction.
In this case, the key price levels to watch are $60k and $50k. A breakout in either direction is likely to indicate where BTC trades over the next month or two.
The post Bitcoin records sixth straight monthly green candle: What’s BTC’s price outlook? appeared first on Coin Journal.


