
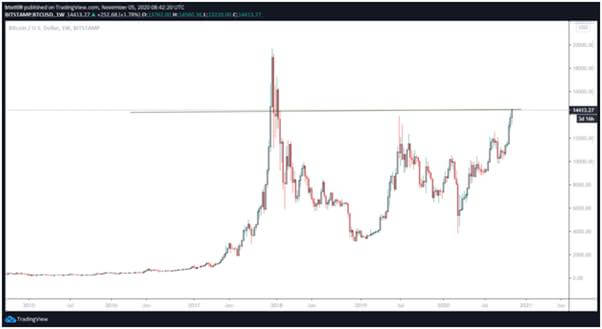
The last time Bitcoin price traded higher than the peak reached over the past 24 hours was in January 2018
Bitcoin has touched $14,560, its highest price level in 2020, and could likely jump to $16,000 if the bulls maintain the momentum in the coming weeks.
As we noted yesterday, Bitcoin’s price against the US dollar had retreated sharply after a steady climb to highs of $14,100. The initial rejection looked like it could give bears a window, but so far, BTC/USD looks strong as the bulls eye $15,000 level.
The BTC/USD pair has printed a higher weekly candle for four straight weeks and is forming yet another. If it achieves this, Bitcoin’s price would likely close above $14,500, a scenario likely to clear the path for a new 2020 peak.
BTC/USD price has jumped over 100%.
Notably, breaching the $14.5k barrier and topping out around $15,000 will leave Bitcoin price just about 40% away from creating history.
One technical analyst says that people might only realise the significance of the upside if the BTC price jumps to $16,000.
“Again, Bitcoin printing higher-highs on the daily [chart] at over $14,000. Yet it seems like it’s doing so without much excitement. Could be the election distraction, but it doesn’t seem like many realise how big this is. Send it straight over $16k, and maybe that will wake a few up.”
Charles Edwards, the founder of Capriole Investments, simply observed, “The significance of this Bitcoin breakout above $14K cannot be understated. The train has left the station”.
Bitcoin price technical picture
Bitcoin is charting a bullish path, with price currently trending within a rising channel. The region has several positive signals on the hourly and 4-hour charts to strengthen the picture for another leg up.
The MACD indicator on the hourly chart is strengthening, while the RSI continues to trend in bullish territory.
The 78.6% Fibonacci (Fib) retracement level of the swing high from $13,500 low to $14,550 high is at $14,228. The 61.8% Fib level also resides here ($14,087).
If bulls hold prices above these levels and flip the $14,350 area into a major support zone, a decent run will likely see them test bear resolve near $16k.
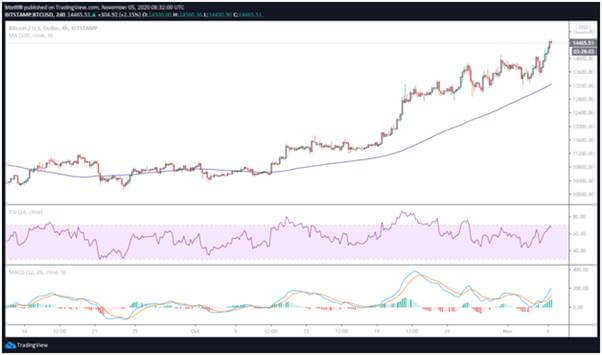
However, if downside correction materialises, the first support line is around $14,350 and the aforementioned Fib levels.
The psychological $14,000 price level provides the next support area, and beneath this level, the BTC/USD pair has support at $13,950 as marked by the 50-SMA and 100-SMA on the 4-hour chart.
A break below the lower boundary of the channel could push prices towards lows of $13,800 and the 100-SMA (hourly chart).
The post Bitcoin ready to explode to $16,000 appeared first on Coin Journal.