The price of Bitcoin (BTC) rose to highs of $28,387 against the US dollar
Bitcoin is trading around $26,300, slightly lower from its new all-time high reached over the weekend. The dominance index is also dipping after rising well above the 70% mark, while the world’s largest cryptocurrency has seen its market cap drop to $492 billion after crossing the 510 billion mark.
BTC/USD outlook
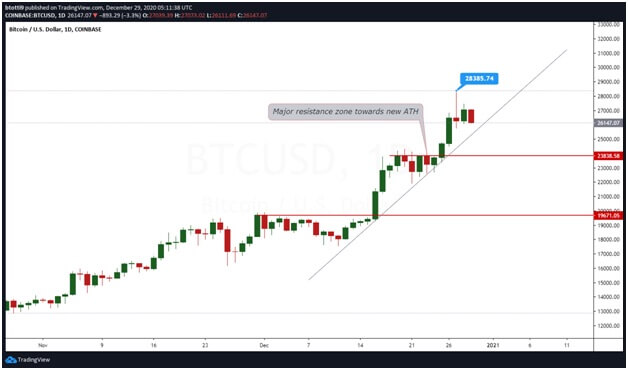
Bitcoin had a great Christmas weekend as its price cleared several hurdles to hit a new all-time high above $28,000.
After breaking above the major resistance area around $25,000, BTC price surged to highs of $27,000 before slowing down. However, fresh buying pressure provided an impetus to the Santa rally as another spike catapulted the BTC/USD pair to highs of $28,387 on Coinbase.
BTC/USD chart showing the new all-time high above $28k. Source: TradingView
At the time of writing, the price of Bitcoin has pulled back to $26,300 but remains bullish for attempts near $30k.
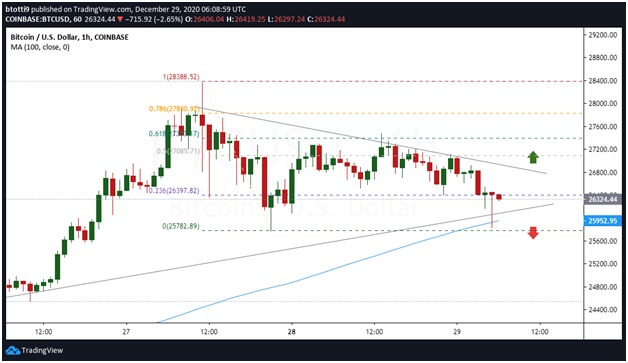
The technical outlook on the daily charts suggests that bulls need to hold above the $26k support zone to retain the upside advantage. A contrary view would provide for a strong retracement in the coming days, with a potential dip to support at lows of $23,000.

BTC/USD daily chart. Source: TradingView
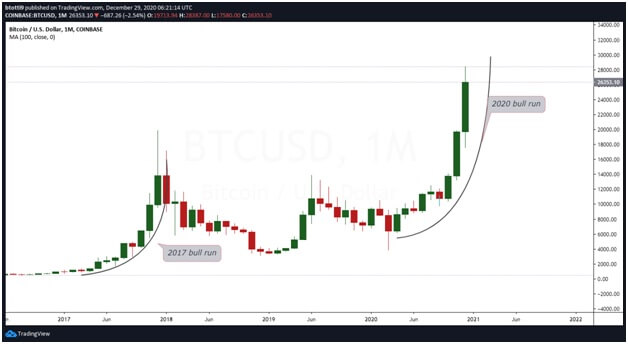
The hourly chart shows that Bitcoin is seeing increased bidding above the $26,000 support level. However, bulls have so far managed to reclaim the anchor of the 100-hourly simple moving average to prevent further losses.
As can be seen in the chart below, bears did break below the 100-SMA ($25,952), but whales were quickly able to buy the dip as shown by the long tail of the candlestick.

BTC/USD hourly chart. Source: TradingView
Short term, price is likely to track the bearish trendline forming on the hourly chart. In this case, a downward action would provide sellers with targets below the 100-SMA and the support line near $25,600. If bears manage to take control at this level, the BTC/USD pair will likely retrace to its main support zone around $23,000.
On the upside, if there’s a break above the trendline and the $26,800 resistance line, buyers can target the 50% Fibonacci retracement level ($27,057). Beyond this, the 61.8% Fibonacci retracement level of the swing from $28,387 high to $25,782 low offers the next resistance level at ($27,393).
A breakout above this level can bring back the focus on $28,400 and possibly the psychological barrier at $30,000.
The post Bitcoin price sees new all-time high above $28,000- Analysis appeared first on Coin Journal.


