
Bitcoin (BTC) spending over three weeks in the $30,000 range is proving a crucial test for one of its best-known price models.
As noted by Philip Swift, co-founder of trading suite Decentrader on June 11, Bitcoin is issuing a major challenge to the stock-to-flow price forecasting tool.
Is it bounceback time for BTC price?
BTC price action has hovered in a lower corridor between $30,000 and $40,000 since mid-May. This has worried day traders, while vintage bulls have called for calm and a long-term mindset.
As Cointelegraph reported, the stock-to-flow model continues to accommodate such behavior, even if its estimates call for a BTC/USD value closer to $70,000.
Its creator, PlanB, has nonetheless voiced concern over the future. Should current levels remain for a longer period, his model risks becoming invalidated for the first time in its history.
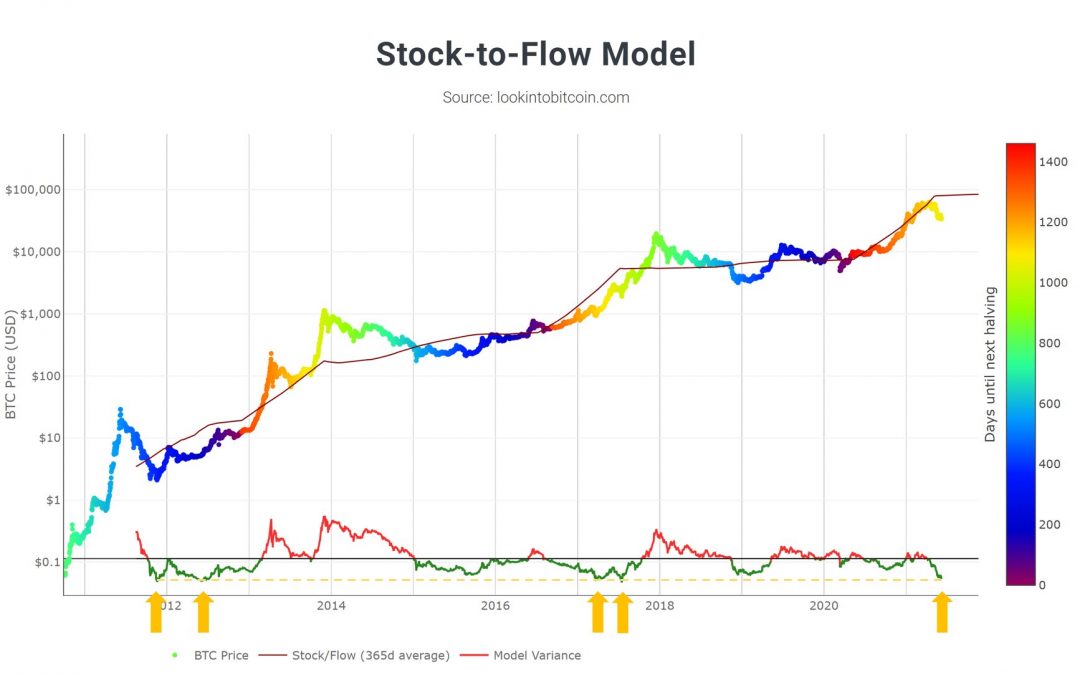
Highlighting spot price divergence from the stock-to-flow average, Swift explained that such instances have in fact occurred before. Each time, Bitcoin bounced off a given price point relative to the stock-to-flow average to eventually hit new all-time highs.
“It’s a long time since price has been this far below S2F line,” he told Twitter followers.
“Divergence oscillator at bottom of the chart is highlighted by the orange dotted line and arrows to show comparable historical periods. Bitcoin price rebounded hard from such divergence previously.”
PlanB eyes moving averages
Previously, PlanB suggested that this year’s Bitcoin bull cycle is more reminiscent of 2013 than 2017 thanks to the veracity of May’s price dip.
Both 2013 and 2017 ultimately saw a two-tier run to an all-time high. The first peak was followed by a significant drawdown in each instance, which then reversed to spawn a run to a new top.
PlanB still believes that $100,000 per Bitcoin will appear this year, while stock-to-flow calls for either a $100,000 or $288,000 average price between now and 2024.
Related: Bitcoin drops below $36K as century-old financial model predicts big BTC crash
Earlier this week, he referenced two key day moving averages (DMAs) as a potential launchpad for a recovery in the coming months.
“If June close will be $54K (or higher) and July, August also $54K (or higher), then 50DMA will bounce off 200DMA and stay above 200DMA,” he tweeted.
“So a nice short squeeze and V-shaped bounce back to $54K (+69%) would result in then bounce back scenario.”
