
Key Takeaways
- Bitcoin’s price holds near $84,600 to $84,887 after retreating from the $87,219 area.
- BTC faces its first upside trigger between $85,000 and $85,500.
- Bitcoin’s 12 tracked moving averages remain bullish as MACD signals a bearish reading.
1-Hour Chart: Bitcoin Builds a Tight Base After the Sell-Off
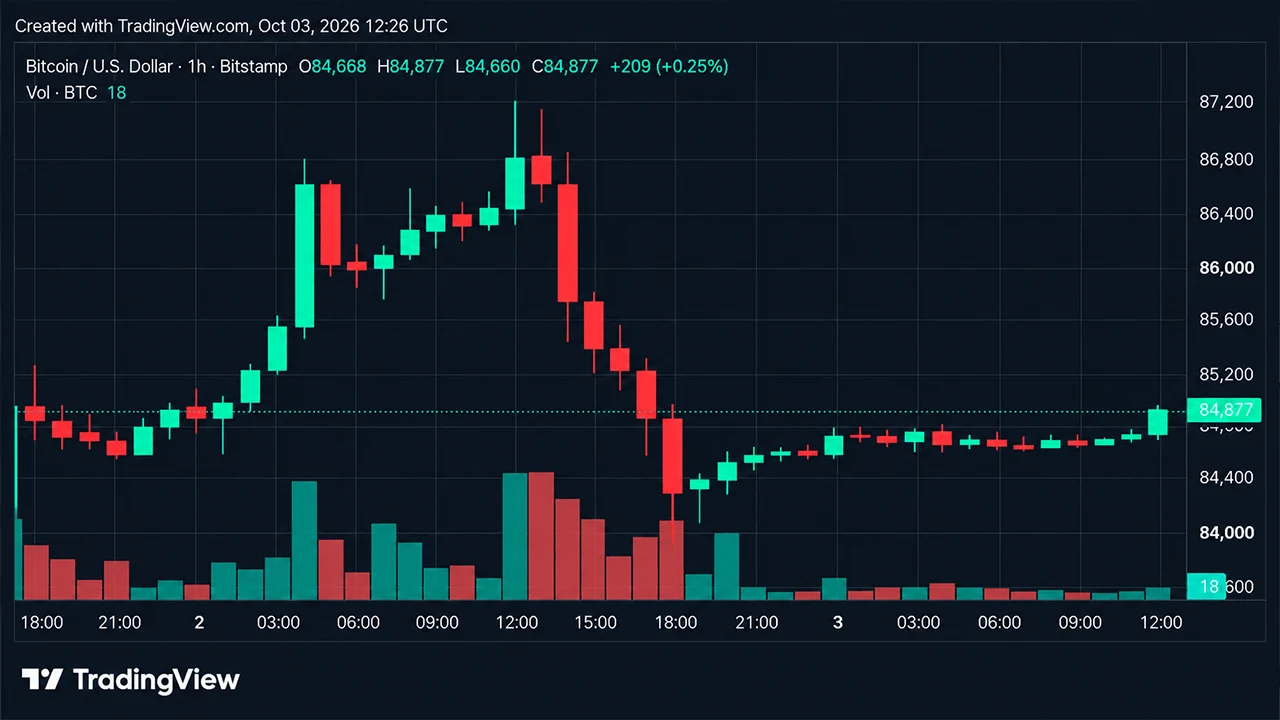
The 1-hour chart shows bitcoin’s price settling into consolidation after falling from $87,219 to $83,841, with the price subsequently building a narrow shelf around $84,400 to $84,700 as volume steadily declined. That compression puts $84,800 to $85,000 in the spotlight as the first upside trigger, while a clean hourly break accompanied by expanding volume would bring $85,500 and then $86,000 to $86,500 into view.
On the flip side, losing $84,300 would expose $83,841, followed by $83,500. A defended retest of $84,300 to $84,500 offers a clearer short-term entry zone than chasing price in the middle of the range.
4-Hour Chart: Bulls Need to Reclaim $85,000
The 4-hour structure remains constructive, though the rejection from $87,219 left a visible dent in short-term momentum. Buyers stepped in around the low-$84,000s, and the candles that followed produced consolidation rather than another forceful leg lower.
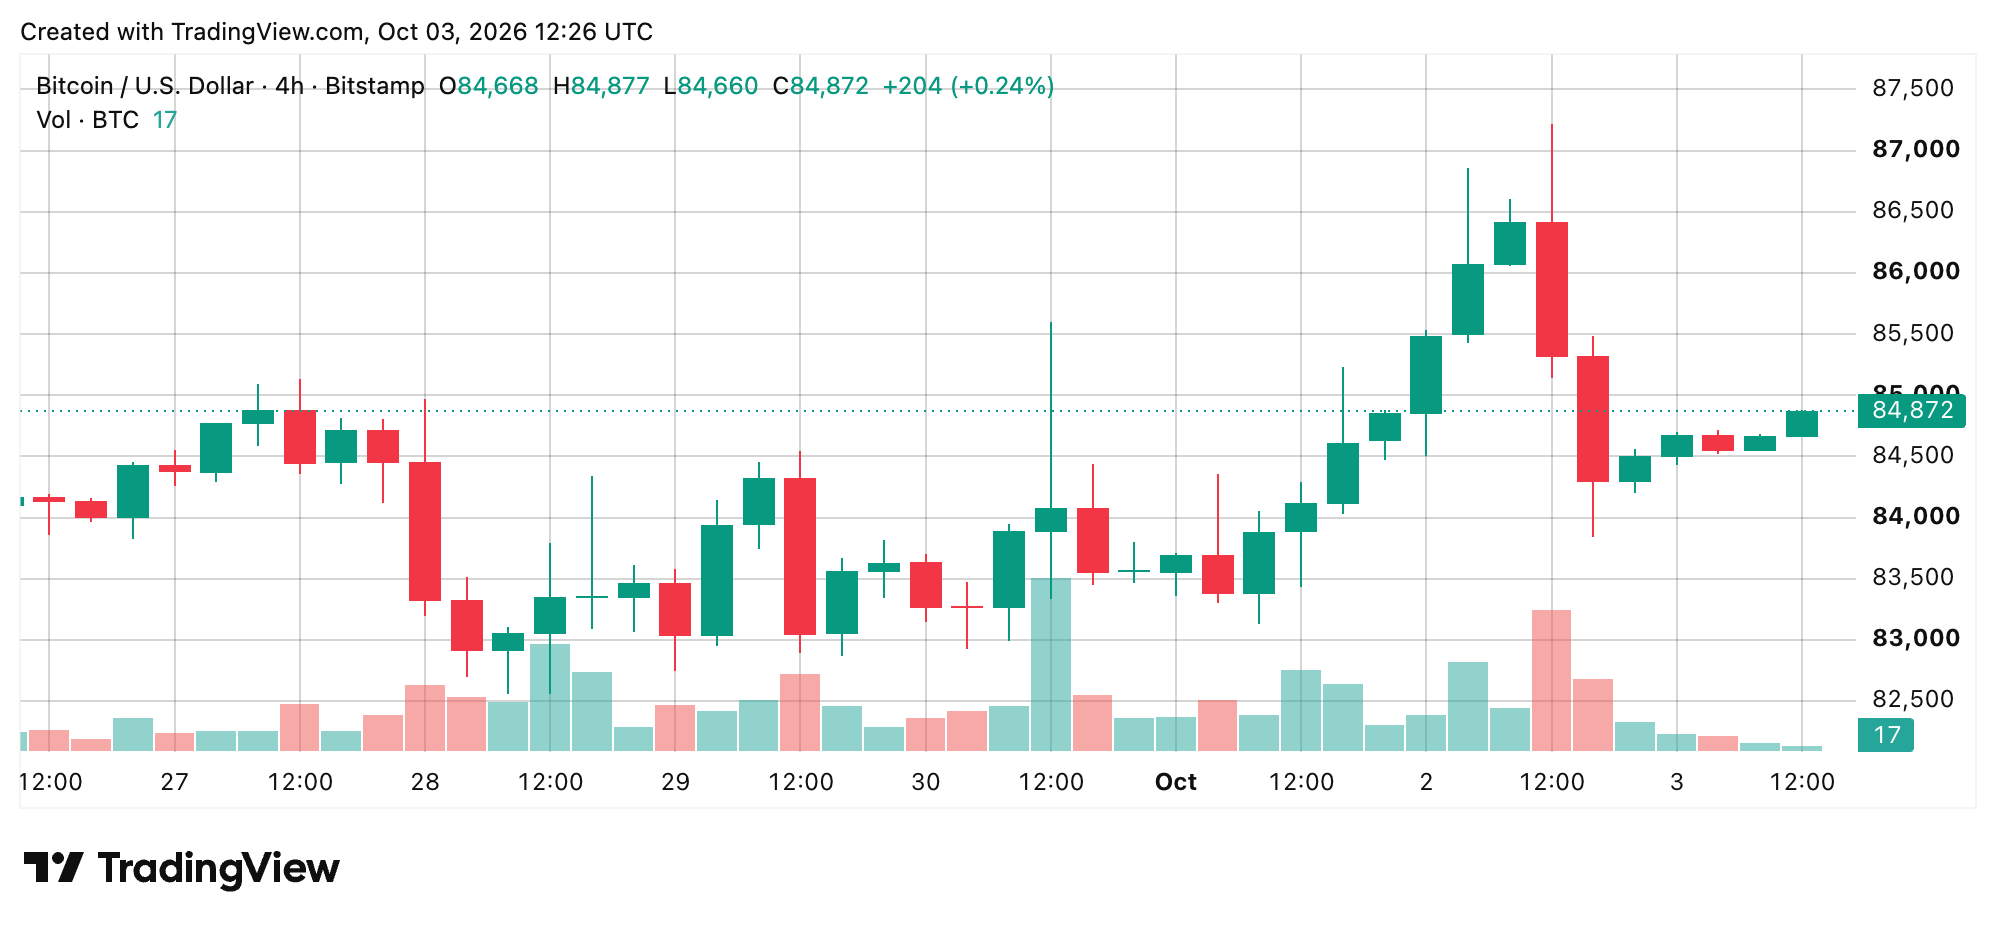
Bulls need to reclaim the $85,000 to $85,500 region to reopen a path toward $86,000 and eventually $87,219. Support rests around $84,000 to $84,300, followed by $83,300 to $83,800. A 4-hour close beneath that lower support zone would materially weaken the rebound structure, while continued defense of the low-$84,000s keeps the recovery setup intact.
Daily Chart: Broader Uptrend Holds Its Ground
The daily chart remains in consolidation following bitcoin’s move from $74,913 to a high of $87,374. Price has repeatedly attracted buyers in the $83,000 to $84,000 neighborhood, while sellers have controlled the upper-$85,000s through $87,000.
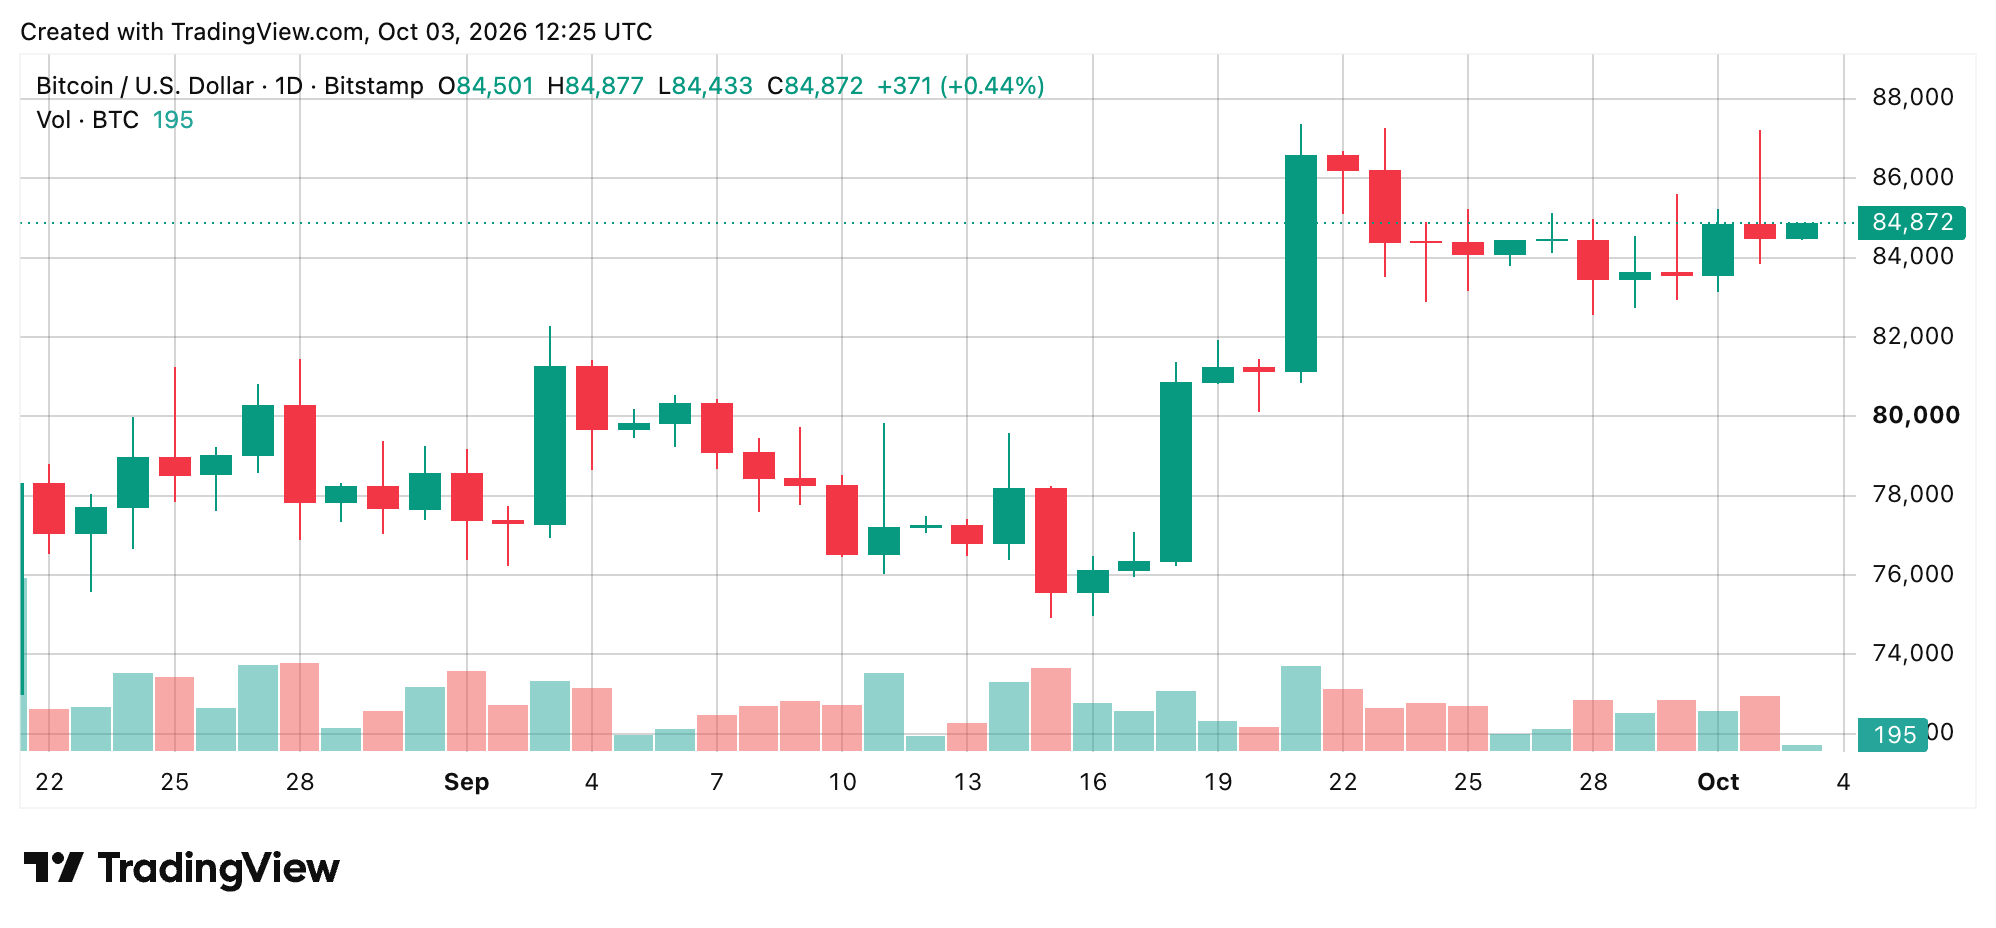
A daily close above roughly $85,500 to $86,000 would strengthen the case for another run at $87,374, whereas $82,555 remains the important structural floor below. Losing that level would expose considerably more downside room toward $81,000 and potentially $80,000. For now, the daily structure also remains above the major technical baselines tracked by Bitcoin.com News.
Oscillators Split as Momentum and MACD Disagree
The 24-hour timeframe’s oscillator board is overwhelmingly neutral, but two readings break ranks. The relative strength index (RSI) at 63.55, Stochastic at 66.89, commodity channel index (CCI) at 53.78, average directional index (ADX) at 41.99, and Awesome oscillator (AO) at 3,693.55 are all neutral.
Presently, Stochastic RSI Fast reads 22.30, Williams percent range stands at -37.07, bull bear power is 1,930.67, and Ultimate oscillator (UO) registers 45.42, also neutral. Momentum, however, reads 282.55 and signals bullishness, while the moving average convergence divergence (MACD) level at 1,932.11 signals a bearish reading, reflecting the immediate retracement and consolidation after the local high.
Moving Averages Keep the Broader Bull Case Alive
The daily chart’s moving averages (MAs) tell a much cleaner story, with every recorded reading signaling bullish conditions. The 10-period Exponential Moving Average (EMA) sits at $83,964.49, and the 10-period Simple Moving Average (SMA) at $84,201.57, placing the current price above both. The 20-period EMA and SMA stand at $82,657.76 and $82,435.23, respectively, while the 30-period EMA and SMA register $81,218.34 and $81,075.10.
Farther down, the 50-period EMA is $78,556.96 and SMA $78,553.04, the 100-period EMA is $74,880.84 and SMA $70,999.26, and the 200-period EMA is $74,718.84 against a $71,425.97 SMA. The immediate $83,964 to $84,200 band, therefore, remains the closest moving-average support zone, with the $82,435 to $82,658 area providing secondary structural support if that floor gives way.
Bull Verdict:
Bitcoin’s broader structure remains firmly constructive, with price holding above every tracked moving average and buyers defending the low-$84,000s. A decisive reclaim of $85,000 to $85,500 would put bulls back in the driver’s seat, opening the door to $86,000 before the $87,219 to $87,374 region returns as the major test.
Bear Verdict:
Bitcoin’s price remains well below its recent highs, while the MACD reflects bearish pressure, and the rebound has unfolded on thin volume. Another rejection around $85,000 to $85,500, followed by a break beneath $83,800, would shift short-term momentum toward the bears and put the crucial $82,555 structural floor squarely on the radar.