
Key Takeaways
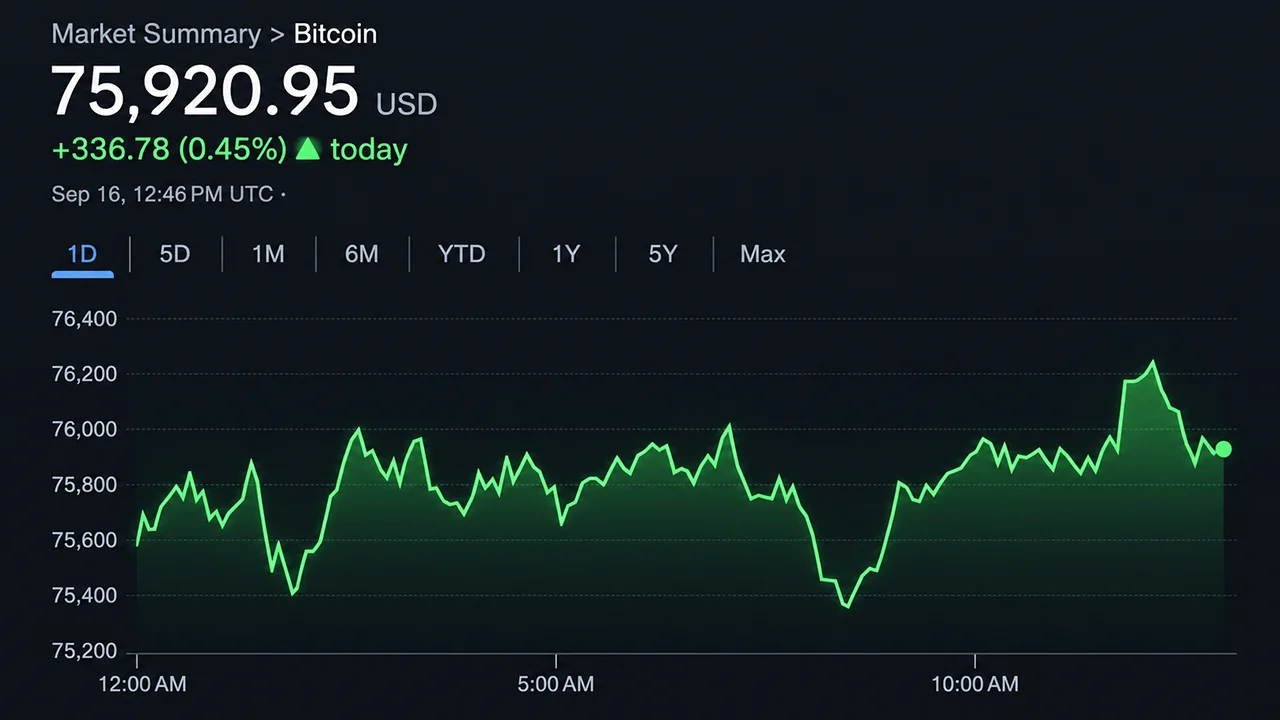
- Bitcoin’s price held above its $74,913 wick low as buyers defended the $75,000 area.
- Bitcoin’s daily technicals stayed neutral, with 8 moving averages flashing negative.
- Bitcoin’s price needs to reclaim $76,000-$77,000 to target the $79,800-$82,300 zone.
One-Hour Chart: Buyers Defend $74,913, but the Bounce Needs Muscle
On the 1-hour chart, bitcoin’s price drama centers on a local high of $79,837 and a long lower wick that reached $74,913 before buyers stepped back in. Price subsequently recovered to roughly $75,859 at capture, while intraday volume picked up during both the selloff and ensuing bounce.
That puts $74,913 squarely in the spotlight as nearby support. Holding roughly $75,000 to $74,900 keeps the post-wick recovery intact, while a break and hold below $74,900 would establish the first clear lower low of the current 1-hour swing. On the flip side, a move back through roughly $77,000 would return bitcoin to the middle of September’s 4-hour trading range.
Four-Hour Chart: The Late-Summer Sprint Has Turned Into a Grind
Zooming out to the 4-hour chart shows how quickly the tone changed. Bitcoin’s price climbed steeply from a labeled low near $62,470 into a high around $82,281 in early September, but the market has since chopped broadly between approximately $76,000 and $82,000.
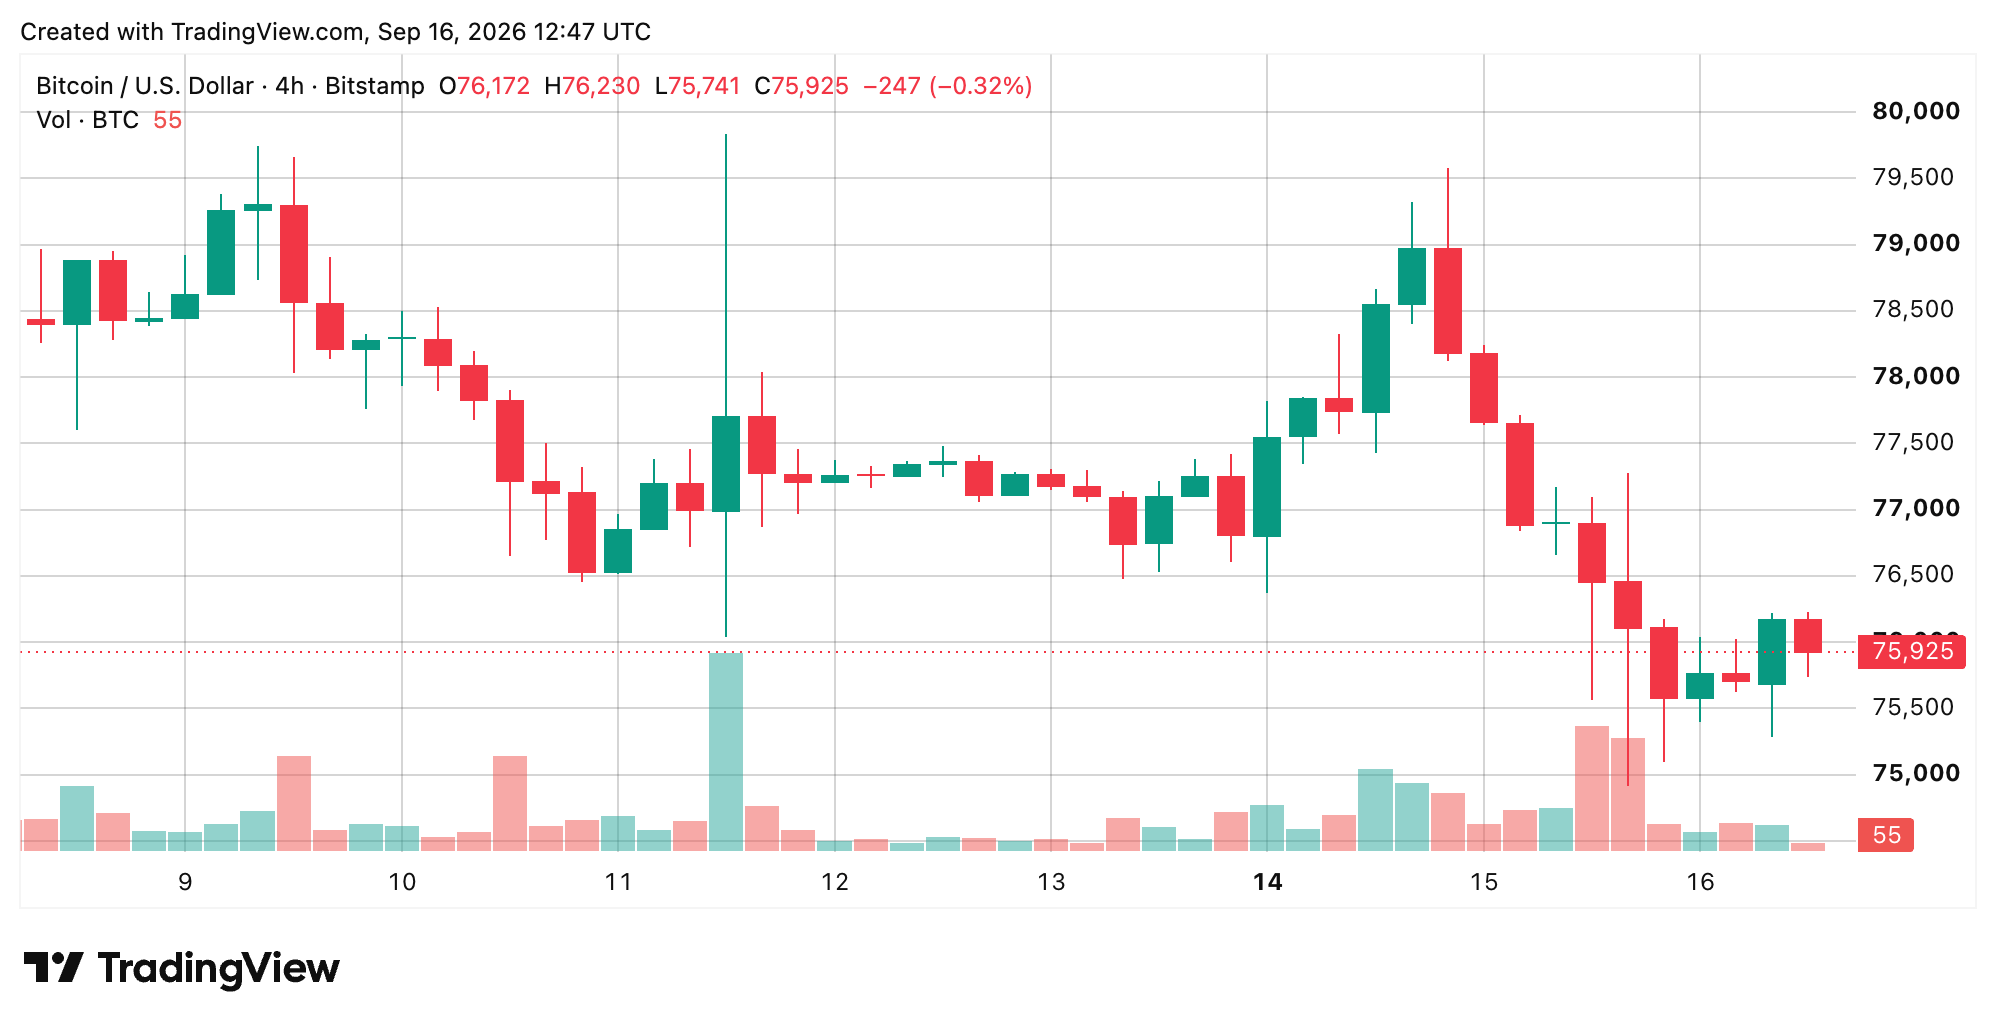
The latest leg carried bitcoin from the upper $70,000s back into the mid-$75,000s, leaving the current print just below $76,000. Nearby resistance begins around the prior $76,000 to $77,000 bounce zone, with the heavier $79,800 to $82,300 cluster waiting beyond it. For now, bitcoin is trying to find its footing after a sizable late-summer run lost steam.
Daily Chart: Bitcoin’s Bigger Structure Hasn’t Cracked
The daily chart offers considerably more breathing room. Visible price history from April through mid-September shows a labeled swing high near $82,833 and a swing low around $57,735 during June and July. Bitcoin’s price recovered through July and August, revisited the roughly $82,000 neighborhood in September, and then pulled back into the mid-$75,000s.
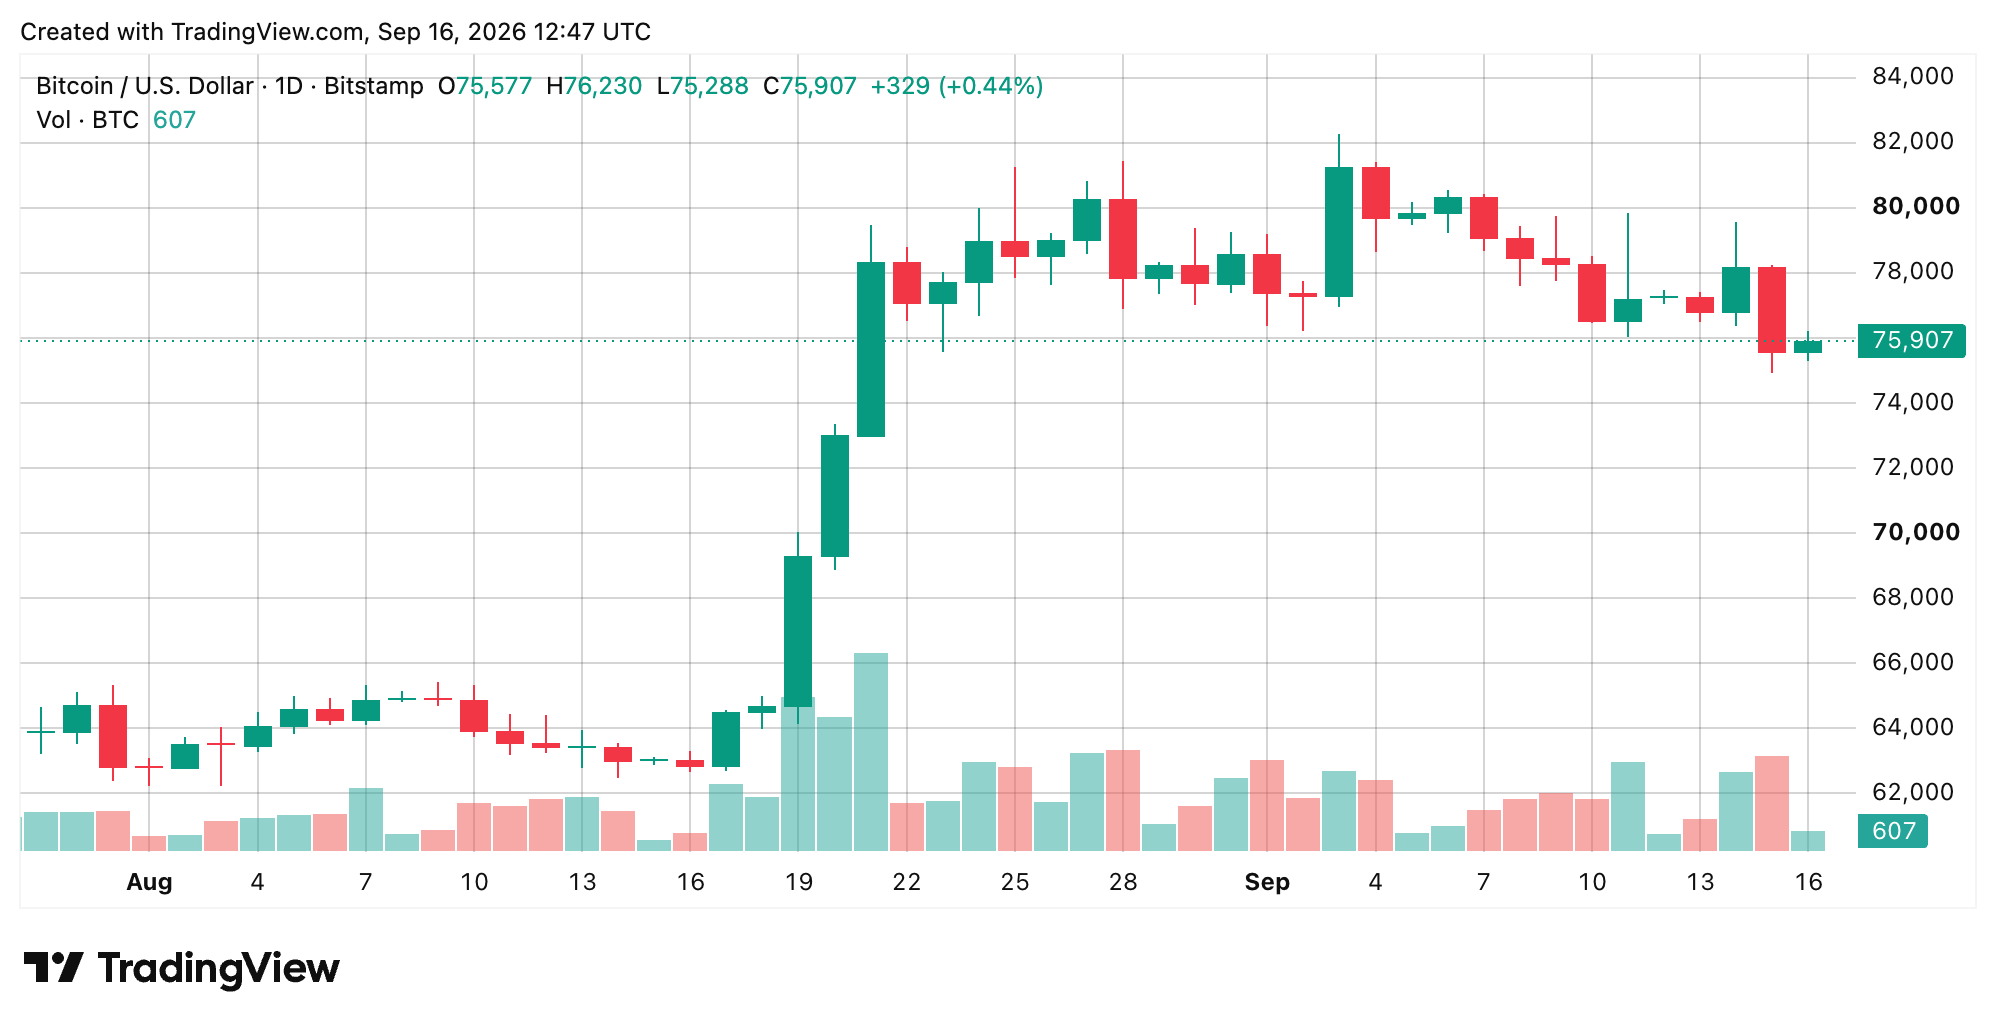
Volume expanded during the midyear decline and again during the late-summer advance. Price is now below the September high and several shorter-term moving averages, yet it remains above the 50-, 100-, and 200-period exponential and simple moving averages. In other words, the shorter view has taken a hit without erasing the broader structure visible on the daily chart.
Oscillators: Momentum Flashes Red While Most Indicators Sit Neutral
The daily chart’s oscillators are mostly sitting on the fence, with eight neutral readings against two negative signals and one positive signal. The relative strength index (RSI) stands at 47, Stochastic at 17, commodity channel index (CCI) at -171, average directional index (ADX) at 41, Awesome oscillator (AO) at 1,407, Stochastic RSI Fast at 8, Williams at -94, and Ultimate oscillator (UO) at 37, all rated neutral.
Momentum (Momentum) reads -4,965, and the moving average convergence divergence (MACD) level is 960, with both rated negative, while the bull bear power (BBP) at -2,989 supplies the lone positive reading. The tally is mixed, but the two momentum-oriented negative readings keep the short-term picture from looking particularly comfortable.
Moving Averages: Short-Term Pressure Meets Long-Term Support
The moving averages (MAs) tell the clearest two-sided story. The 10-, 20-, and 30-period exponential moving averages (EMA) stand at $77,050, $76,820, and $75,703, respectively, while the corresponding simple moving averages (SMA) sit at $77,278, $78,046, and $77,262, with all six rated negative. By contrast, the 50-, 100- and 200-period EMA readings of $73,532, $71,345, and $73,080, and SMA readings of $71,883, $67,584 and $70,282 are all positive.
The Ichimoku baseline (IBL) at $78,597 on Wednesday is neutral, while the volume-weighted moving average (VWMA) at $78,029 and Hull moving average (HMA) at $76,175 are negative. That leaves the moving-average scoreboard at eight negative, six positive, and one neutral, neatly capturing bitcoin’s current tug-of-war between short-term weakness and longer-term support.
Bull Verdict
Bitcoin’s defense of the $74,913 wick keeps the bullish case alive, with longer-term moving averages still providing support beneath spot. A sustained push through $76,000-$77,000 would strengthen the recovery and put the $79,800-$82,300 resistance cluster back in play.
Bear Verdict
Bitcoin’s short-term structure remains vulnerable, with momentum and the moving average convergence divergence (MACD) both negative and shorter moving averages leaning bearish. A break and hold below $74,900 would establish a fresh 1-hour lower low, weakening the rebound and handing sellers back the driver’s seat.