Bitcoin (BTC) hodlers may need to triple their on-chain losses for BTC price to put in a macro low.
According to market research firm Baro Virtual, the 2022 bear market is not yet harsh enough to match historical downtrends.
Bitcoin losses “only” total $671 million
With analysts predicting a return to $14,000 or lower for BTC/USD, the question of where Bitcoin will bottom is one of the hottest topics in the space this month.
For Baro Virtual, which analyzed data from on-chain analytics platform Whalemap, it may be a matter of simple arithmetic.
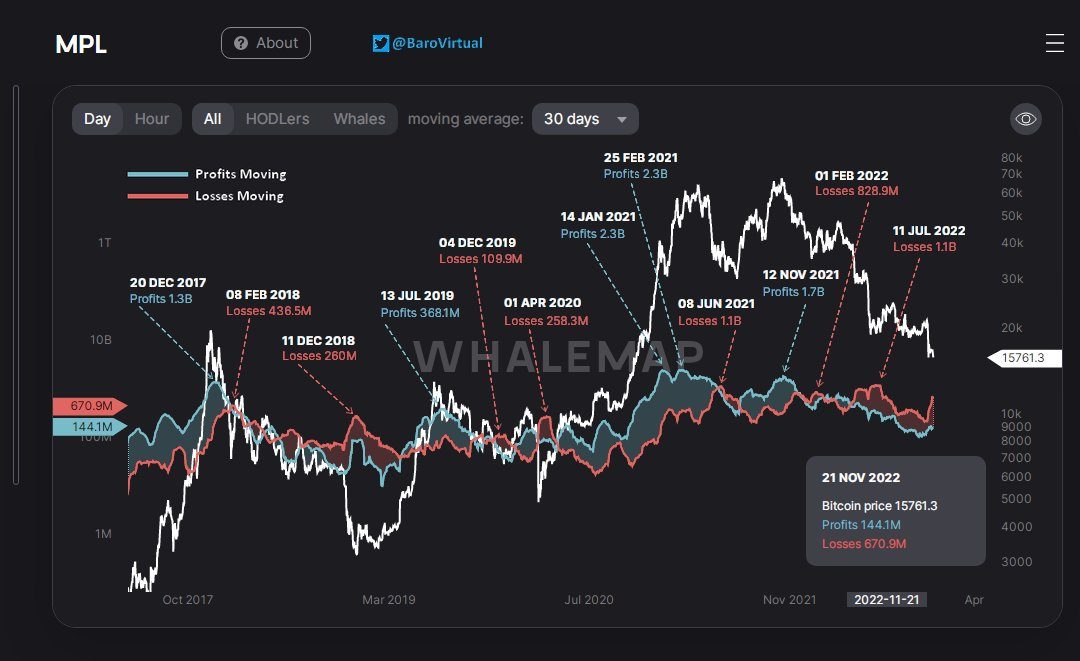
Taking Whalemap’s moving profit and loss (MPL) figures for on-chain BTC transactions, it noted that in the past, macro BTC price bottoms occurred once those transactions’ losses were equal to or more than the equivalent profits in the bull run which preceded them.
In other words, on-chain losses need to equal or exceed on-chain gains from the prior bull run. Otherwise, in most cases, Bitcoin has fallen further later on.
“Monthly MPL by Whalemap makes it almost sure, in most cases, to determine the global bottom of $BTC,” Baro Virtual wrote in Twitter comments on Nov. 22:
“The condition is that the current loss level must be equal to or > than the max profit level of the previous bull run.”
Current realized losses are thus not large enough to fit Bitcoin’s historical capitulation trend, it argued, leaving the door open to further BTC price capitulation.
How much is needed, however, could mean that the ultimate macro bottom for Bitcoin lies much lower than this week’s two-year low of $15,480.
“Now the losses are $671M, and the previous max profit is from $1.3B to 1$.7B,” the thread continued alongside an annotated chart:
“Thus, losses from $629M to $1.029B are still missing to confirm complete capitulation.”
BTC targets 80% drawdown
The findings complement a narrative that likewise suggests that the 2022 bear market is yet to rival 2014 and 2018 — years which saw macro lows in BItcoin’s two prior halving cycles.
Related: GBTC next BTC price black swan? — 5 things to know in Bitcoin this week
Versus the latest all-time high in November 2021, BTC/USD has so far managed a 77% drawdown — less than in prior bear markets.
Data from on-chain analytics firm Glassnode nonetheless shows how Bitcoin is gradually homing in on a retest of maximum losses versus all-time highs.

Likewise, the percentage of the overall BTC currently held in profit is almost, but not quite, at lows synonymous with macro bottoms.

“Bitcoin’s 78% drawdown over the last year is its largest since 2017-18 and at 376 days is now the 2nd longest, trailing only the 2013-15 decline of 410 days,” Charlie Bilello, founder and CEO of Compound Capital Advisors, additionally noted this week.
The views, thoughts and opinions expressed here are the authors’ alone and do not necessarily reflect or represent the views and opinions of Cointelegraph.


