Bitcoin (BTC) price could dip to $21,820, which is the 21-EMA on the weekly time frame
Bitcoin’s bad week could get worse if the price dips below $30,000 again to retest intraday lows of $28,800.
At the moment, bulls are looking to bounce right back into the game, which will happen if they break above the previous support-turned-resistance level at $32,000.
A rejection leading to a slip beneath $28,000 could see a potentially bearish scenario to lows of $21k—$18k. This outlook will be likely if a 2017 fractal charts again.
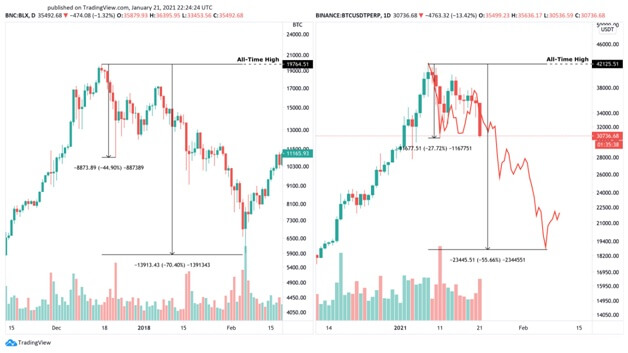
According to technical analyst Ali Martinez, bears could push as far as $18k if BTC’s price trajectory mirrors the 2017 fractal post-ATH. A 70% dump from the all-time high saw BTC bottom out around $5,900 as the 2018 bear market unfolded.
The analyst thinks something similar to that could materialise in the coming days (or weeks). He shared the chart below and added:
“If something similar to what happened in mid-December 2017 repeats, Bitcoin may dive towards $18,000.”
Image showing BTC price action in 2017/2018 and 2020/2021. Source: Ali Martinez on Twitter
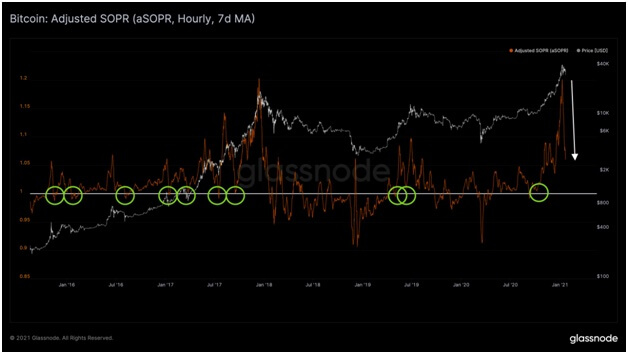
An on-chain metric called Spent Output Profit Ratio (SOPR) also suggests BTC price could see further dips. SOPR helps gauge trends by showing whether spent outputs are in profit or loss. If the metric reading is above 1, it indicates output transactions were in profit. Values less than 1 mean that holders were at a loss when the output transaction happened. Sell pressure mounts when the metric suggests most holders are in profit.
According to Rafael Schultze-Kraft, Bitcoin’s dip from highs of $38,000 to support at $28,800 “is not surprising“. Rafael, who is the CTO of Glassnode, says that currently, the SOPR is overextended and moving towards 1. The metric thus suggests that less BTC is moving on-chain as some holders sell at “extreme profits“.

Bitcoin SOPR metric suggests further sell-off pressure. Source: Glassnode
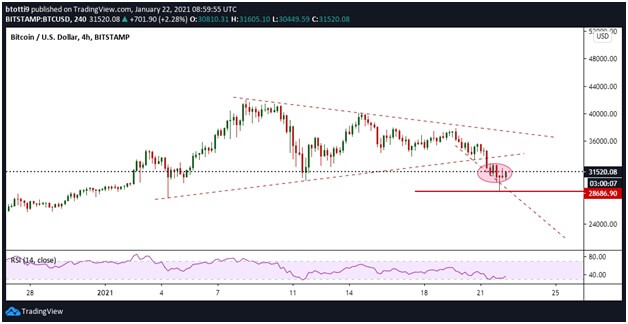
As seen on the 4-hour chart below, BTC/USD has had multiple candle-down closes below the major support level around $32,000. Turning this previous support zone into resistance adds credence to the likelihood of a further breakdown.
If the decline continues, the key price level to watch on a higher time frame is the 21-EMA. Short-near-term price action is likely to include a revisiting of the weekly 21-EMA before another leg higher. The price level of the moving average is around $21,820.

BTC/USD 4-hour chart. Source: TradingView
On the contrary, a daily close above $30k, with highs of $32k in between could preserve the upside outlook. A move towards the $35k threshold will be the short term target if bulls have to consolidate towards a retest of the $42,000 resistance level.
The post Bitcoin fractal hints at steeper correction if bulls fail to hold $30k appeared first on Coin Journal.


