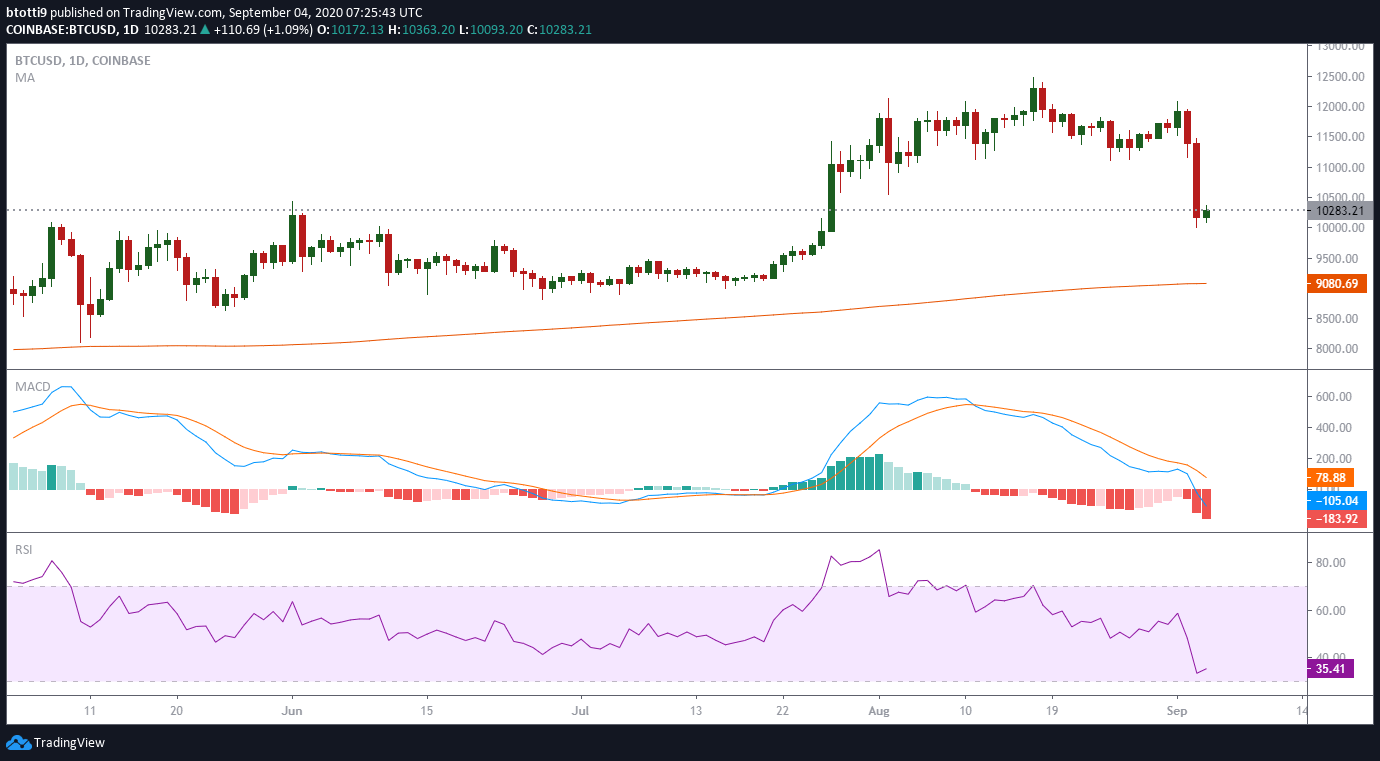
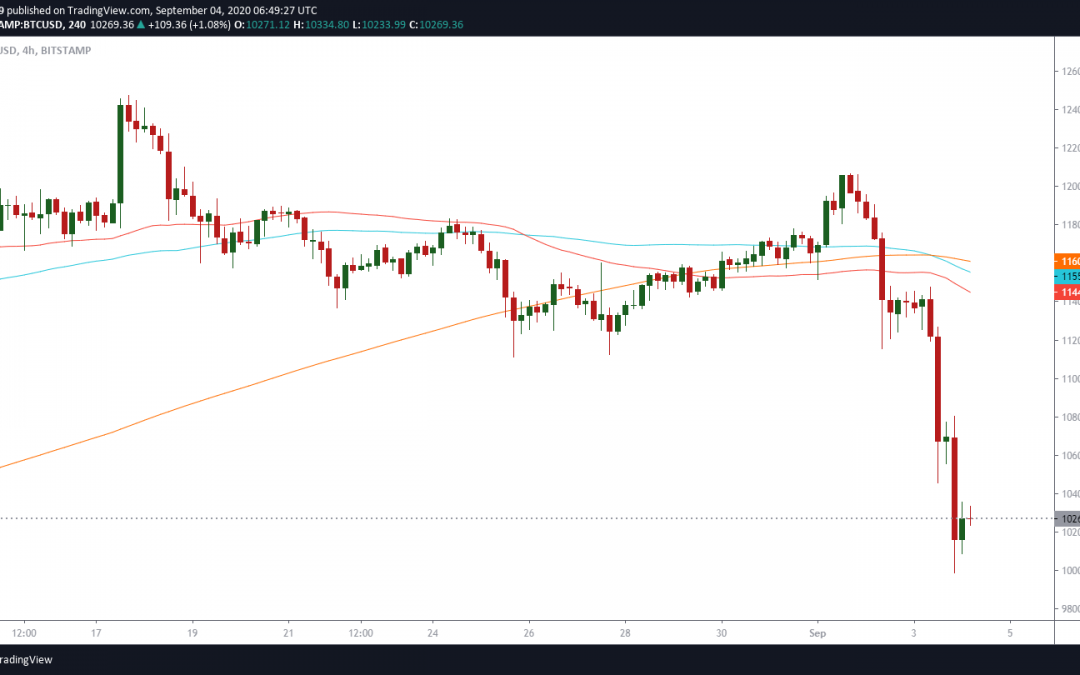
BTC/USD price fell to $9,990 on some exchanges, with tech stocks posting similar slumps Thursday.
This is turning into one miserable week for Bitcoin and pretty much every other cryptocurrency as prices plunge to new multi-month lows.
After bears pushed BTC/USD to lows of $11,000 on Wednesday, an attempt by bulls to rebound failed big time at the $11,400 resistance level.
A massive sell-off in the crypto and stock markets sent assets tumbling, with top tier asset pair BTC/USD registering a minus $1, 200 on the daily charts. The rout came to a stop around $10,000, with the price dipping to lows of $9,990 on some exchanges.
With that, Bitcoin dipped below $10,200 for the first time in nearly two months, a scenario that sees traders now looking at a potential pullback to lows of $9,700.
BTC/USD CME futures ‘gap’
This week’s violent market action comes after BTC/USD retested resistance at the $12k mark via a local top around $12,050. The last time the cryptocurrency traded higher was on August 17 when bulls rallied to a 2020 high of $12,485.
Notably, though, the gains that followed BTC/USD’s bullish rally above $10k in late July-mid-August left a ‘CME gap’ that has yet to be filled. A gap appears when Bitcoin trades higher after the CME closes, and has in most cases seen prices retrace to that very level over the next week.
The last major gap did not fill as BTC/USD raced to $12,500 highs, which is why some market participants anticipate the latest rejection could see the coin’s value hit lows of $9,700.
If the gap fills, BTC/USD will rely on an aggressive comeback above $10,000 to maintain the bull cycle and aim for a crack at $12,000 which is its most recent bogey level.
BTC/USD short term technical picture
A look at the intraday 4-hour chart shows that the Bitcoin has crossed below the 50 EMA, the 50 SMA, 100 SMA, and 200 SMA. These moving averages are all active immediate resistance levels. The RSI is also deeply embedded in the bearish territory in this timeframe, with little to suggest bulls have any surprise move pending.
On the daily chart, BTC/USD is just above the 100 SMA, with the RSI and MACD suggesting a bearish flip. The longer-term 200-day simple moving average provides major support at $9,080.

Stocks also fell
Other than the CME gap factor, the crypto market sell-off mirrored a similar drop in the conventional stock market. While the correlation between Bitcoin’s price and the stock market had shrunk since Black Thursday, the latest sell-off happens to rekindle that.
Major tech stocks Apple, Tesla, and Microsoft fell 8%, 9%, and 7% respectively to see the Nasdaq 100 record its biggest single-day in five months.
As of writing, BTC/USD is changing hands around $10,290, about 9.6% lower in the past 24 hours.
The post Bitcoin dips 10% to hit new multi-month low around $10,000 appeared first on Coin Journal.


