Bitcoin (BTC) hash rate sees 155.4 EH/s even as Bitcoin trades below a declining trendline that could see prices fall below $35k
Bitcoin has touched highs of $36,070 in intraday action today, yet bulls’ failure to sustain momentum towards the hourly 100-SMA could see BTC/USD strengthen a short-term bearish outlook.
This is likely given the zone around today’s intraday highs presents a major resistance line that has capped price action since 14 January.
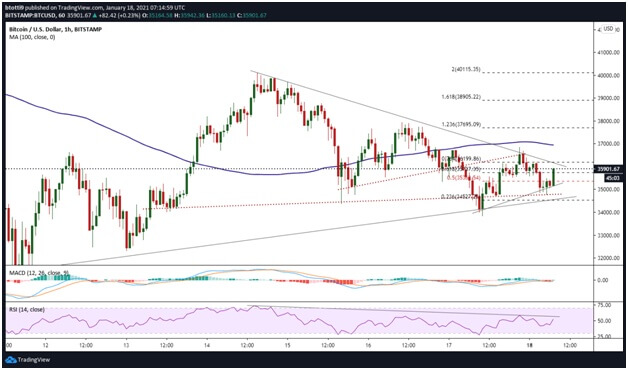
BTC/USD capped below $36,800
Bitcoin has been trading lower over the past four days, with yesterday’s decline seeing prices restricted below $36,800. Today’s upward action follows a similarly strong rebound last week, which had seen BTC recover from a dip to $32,327. But the upside to highs of $40,110 was quickly followed by another dip, with price touching lows of $33,800 over the weekend.
As shown on the hourly chart, failure to break and rally above $36,000 in the coming sessions could strengthen a short term bearish outlook.
The negative perspective is highlighted by the hourly RSI and a declining trendline that is currently restricting bulls around the 76.8% Fibonacci retracement level of the move from $33,830 low to $36,849 high. This level presents a resistance line at $36,212.
Bulls will need to break above this line to target 100 hourly simple moving average ($36,952) and the 123.6% Fibonacci retracement level ($37,695). If the upside momentum holds, increased confidence in Bitcoin’s future price could see buyers seek gains around the 161.8% Fibonacci retracement level ($38,905).
BTC/USD hourly chart. Source: TradingView
On the downside, the 50% Fibonacci retracement level of the recent move from the $33,830 low to $36,849 high provides initial support at $35,360. Further losses might mean bulls regroup at the $35,000 anchor and then the 23.6% Fib level ($34,527).
Are miners positive about BTC price gains?
BTC price could well dip below $35,000, and move towards a potential retest of $30k, with long term losses likely to target the $20k region. But on the upside, BTC/USD is likely to surge to new record highs as its fundamental and technical picture strengthens.
One of the metrics suggesting Bitcoin’s future price might surge beyond its 2020 all-time high is the surging hash rate. At the time of writing, the total computing power on the Bitcoin network has surged to a 7-day moving average high of 155.4 EH/s, the highest it has ever been.
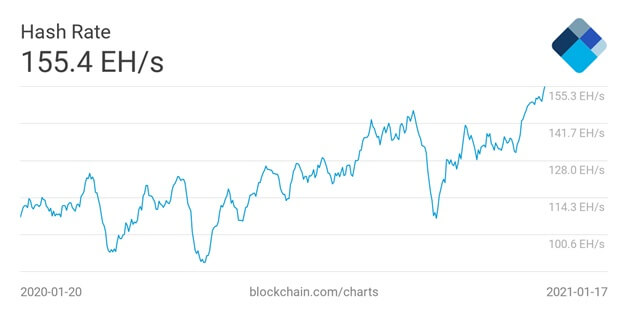
Bitcoin hash rate chart. Source: Blockchain.com
Hash rate has reached a new ATH even as Miners’ Rolling Inventory (MRI) over the past week has dropped to 98%, compared to an average of 144% over the past 5 weeks.
The MRI tracks how much miners sell compared to what they generate, and a decline suggests that miners are positive about the future prices of Bitcoin. It’s therefore likely miners are targeting prices much higher than the ATH before they start selling aggressively again.
The post Bitcoin bulls struggling around $35,000 even as network hash rate rises appeared first on Coin Journal.

