Ether remains on slippery floors despite the weekend’s bounce to $3,000, analysts studying chart patterns told CoinDesk Monday. One source signaled the possibility of a $1,000 drop over the next few weeks.
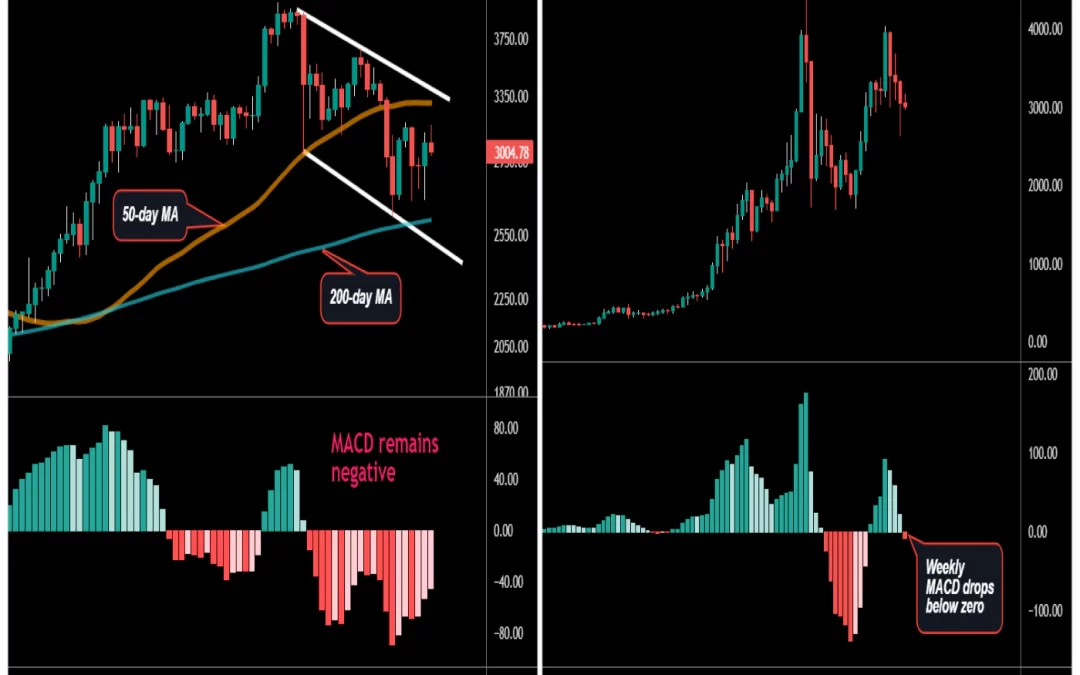
The second-largest cryptocurrency is stuck in a four-week falling channel with the daily chart MACD histogram – an indicator used to gauge trend strength and changes – signaling a downward bias.
“A bearish short-term bias still seems appropriate given the recent breakdown and a negative reading in the daily MACD indicator,” Katie Stockton, founder and managing partner of Fairlead Strategies, said in a weekly research note shared with CoinDesk on Monday.
Ether has established a foothold under the 50-day moving average (MA) in the past few days, having flipped the crucial support into resistance a week ago.
The weekly chart MACD histogram has also crossed below zero this week, adding to bulls’ woes. As per Stockton, the indicator needs to stay negative till Friday to yield a sell signal.
“That would be an intermediate-term setback if we also see [immediate] support near $2,874 taken out,” Stockton said in an email.
Short-term cautious
The last time the weekly MACD turned bearish, in June, ether fell by nearly $900 to revisit May lows near $1,700.
Bill Noble, chief technical analyst at Token Metrics, said both the macro and technical picture appear aligned in favor of the bears for now.
“Broadly speaking, if ether fails to stay above $3,300 there is a risk of a deeper correction to perhaps $1,400 by the end of October,” Noble said in an email. “The Evergrande situation could be similar to the events of 2008, so while the ETH bull case is intact for the long-term, it may be best to be cautious in the short-term.”
A breakout above the 50-day MA would weaken the bear case and expose a path higher, toward the Sept. 16 high near $3,675. Ether was trading near $3,000 at press time, a 2% drop on the day. A push higher by the cryptocurrency earlier Monday was rejected near $3,200.


